
Investment Returns Explained: A Beginner's Guide to ROI, CAGR and Real Returns
Investing Writer
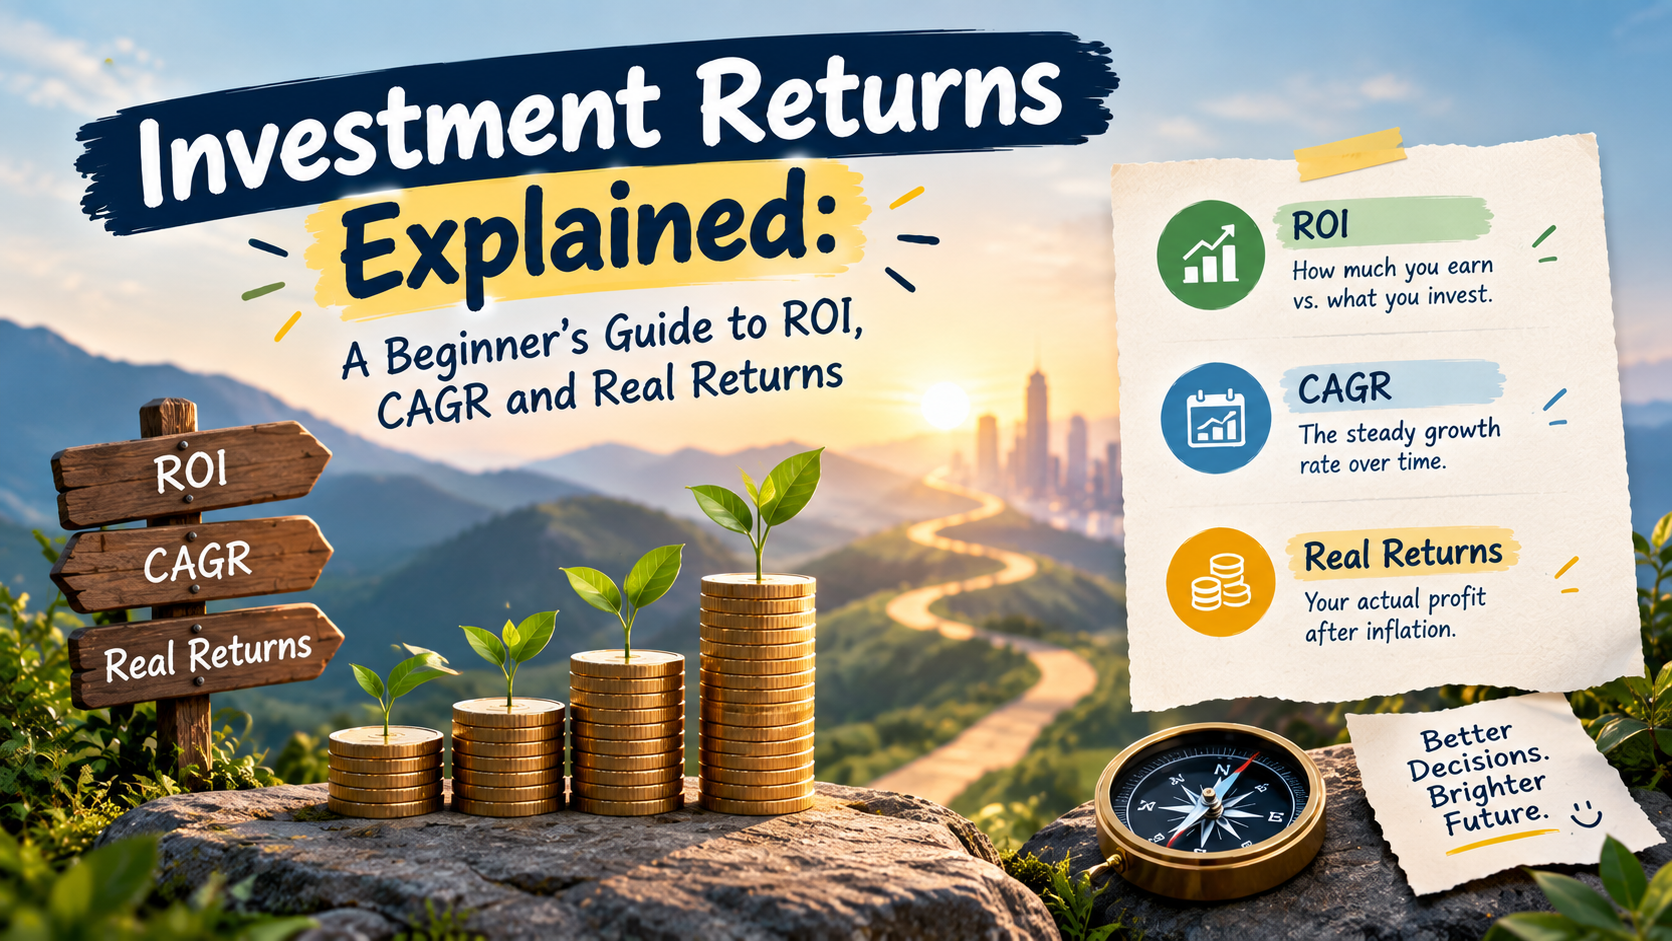
Most investors check one number: how much their account went up. But that single figure hides a lot. Did inflation eat into it? How long did it take? What did fees and taxes take? And is it any good compared with the market? This guide walks through nine ideas, in the order that makes them easiest to learn, so you can read your own returns with confidence. Each section gives you the short version and links to a full lesson in our Understanding Investment Returns course.
Step 1: Learn to Read a Return
The first three lessons build your vocabulary. Once you can tell nominal from real returns and use ROI and CAGR, most headlines about performance become much easier to judge.
Nominal vs Real Returns
An 8% return sounds great until you subtract 3% inflation. Nominal return is the raw growth of your balance, while real return shows how much your buying power actually increased. A savings account can rise every year and still lose purchasing power. Read in detail here: Nominal vs Real Returns.
ROI
Return on investment is the simplest scorecard: your total gain, including dividends, divided by what you put in. Invest $1,000, end up with $1,200, and your ROI is 20%. It's quick and useful, but it ignores how long the investment took, which is where the next measure comes in. Read in detail here: ROI Explained.
CAGR
CAGR converts a multi-year result into one steady yearly growth rate, so you can fairly compare a fund held for four years with one held for ten. It also explains why the simple average of yearly returns usually looks better than what you really earned. Read in detail here: What Is CAGR?
Step 2: See What Builds and Erodes Growth
Next comes the engine room: how growth compounds, how dividends add to it, and how costs quietly take a share. These forces matter more over decades than most people expect.
Simple vs Compound Interest
Simple interest is paid only on your original amount, while compound interest earns interest on interest. Over 30 years at 6%, $10,000 becomes $28,000 with simple interest but about $57,400 with compounding. Compounding frequency, APY, and even debt follow the same math. Read in detail here: Simple vs Compound Interest.
Dividends and Total Return
Price growth is only half the story. Total return adds dividends, and reinvesting them lets them compound. In our example, dividends turned a 5% yearly price gain into roughly 8% a year. The lesson also covers dividend taxes and the high-yield trap. Read in detail here: Dividends & Total Return.
Fees and Taxes
A 1% annual cost sounds harmless, yet over 30 years it can leave you with nearly a quarter less than a low-cost alternative. Expense ratios, advisory fees, and taxes all compound against you. Learn how to spot them and reduce them. Read in detail here: How Fees and Taxes Shrink Your Returns.
Step 3: Add Context and Check Your Own Results
The final lessons put everything in context, showing what history says about the market, how far portfolios can fall, and how to measure your own results honestly.
S&P 500 Historical Returns
The S&P 500 has compounded at roughly 10% a year since 1926, or about 6.5% to 7% after inflation, yet it lost money in about one calendar year out of four. The lesson shows what one-, five-, ten-, and twenty-year outcomes have looked like. Read in detail here: S&P 500 Historical Returns.
Volatility and Drawdowns
Returns tell you where you ended up, while drawdowns tell you what the trip cost. A 50% loss needs a 100% gain to break even, and past recoveries have taken anywhere from months to years. Understanding this helps you choose a portfolio you can actually stick with. Read in detail here: Volatility & Drawdowns.
Measuring Your Own Portfolio
Adding money during the year makes your balance growth misleading. This lesson shows how to measure your personal return with XIRR, compare it with a fair benchmark, and adjust for fees, taxes, and inflation. Read in detail here: How to Measure Your Own Portfolio's Real Performance.
Where to Go From Here
You don't need to master everything at once. If you're new, start with real returns, ROI, and CAGR, then move on to costs and market history. When you're ready to go deeper, explore the full Understanding Investment Returns course, and test your own numbers with our free CAGR Calculator and Inflation Calculator.
Frequently Asked Questions
What is a good investment return?
There is no single answer. A good return beats inflation after fees and taxes, compares well with a fair benchmark over several years, and is enough to reach your goals.
What is the difference between ROI and CAGR?
ROI measures your total gain as a percentage of what you invested and ignores time. CAGR converts that growth into a steady yearly rate, so it works better for comparing investments held for different periods.