
Your Real Stock Market Return Isn't Just the Price Chart
Investing Writer
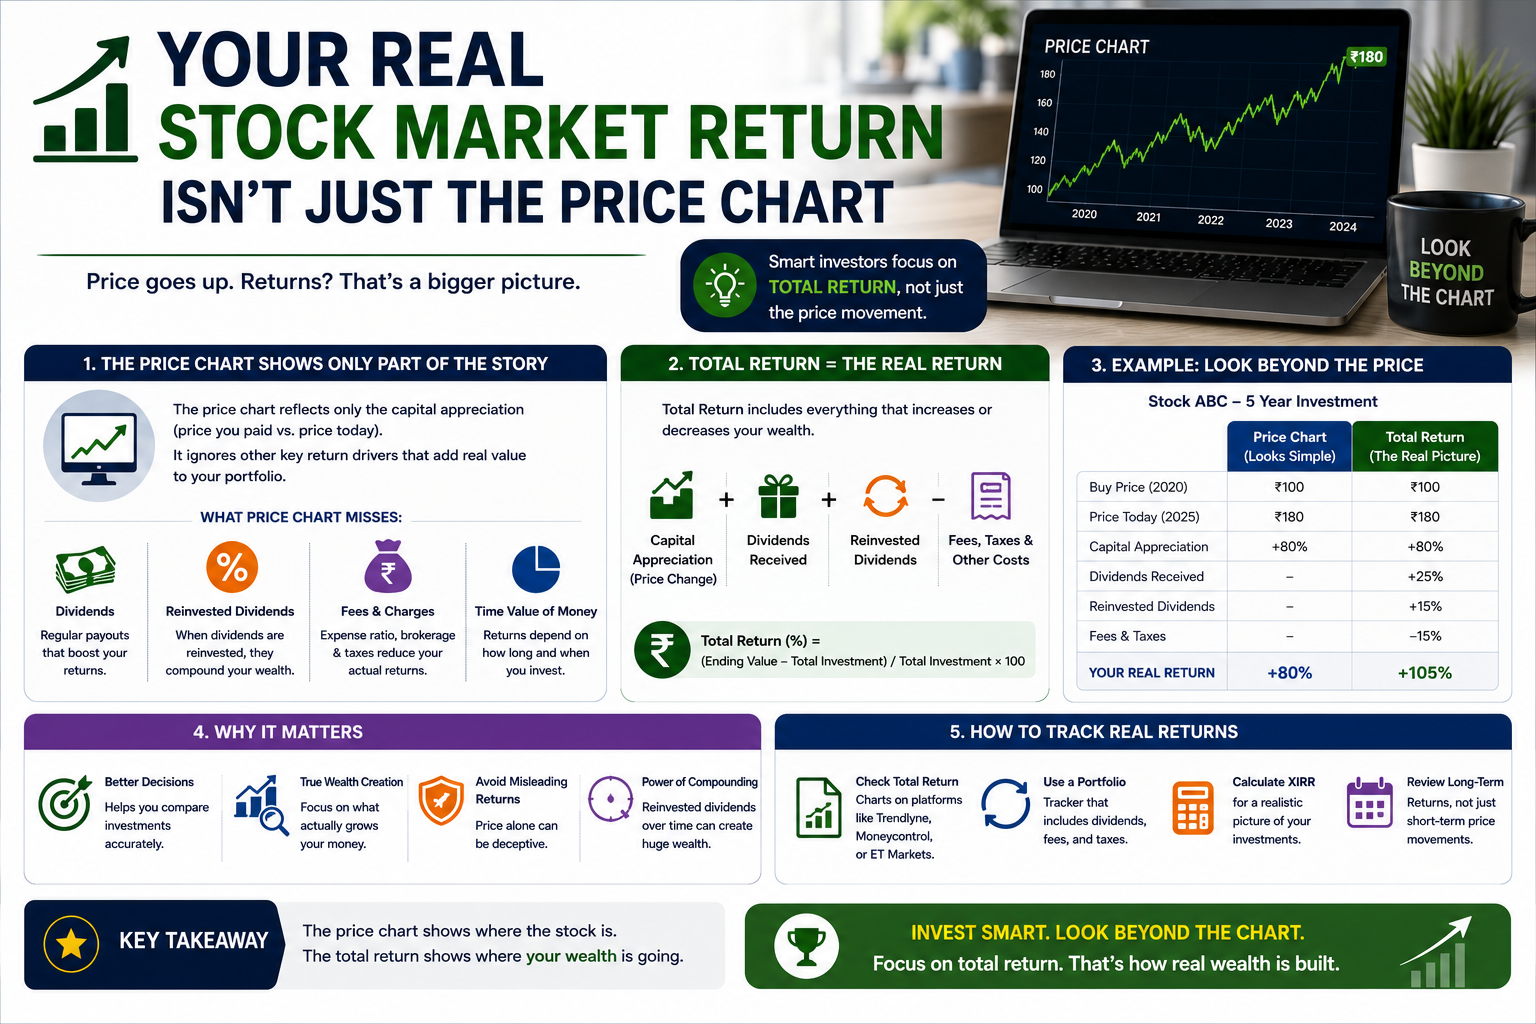
Why the Price Chart Doesn't Tell the Whole Story
When people check how a stock or fund has performed, they usually look at the price chart — where it started, where it is now. But that number leaves out two things that materially affect what you actually earned: dividends and fees. A stock that looks flat on a price chart may have quietly paid out 2-3% a year in dividends, while a fund with a great-looking price return may have eaten a chunk of it in expense ratios along the way.
Price Return vs. Total Return
Price return measures only the change in share price. Total return adds back dividends (assuming they're reinvested) — and for many stocks and funds, that gap is significant over long periods, because reinvested dividends compound on top of the original investment.
| Metric | What It Measures |
|---|---|
| Price return | Change in share price only |
| Total return | Price change + dividends reinvested |
For dividend-paying stocks and index funds held over 10-20+ years, total return is typically meaningfully higher than price return alone — checking only the price chart can significantly understate your real gains.
How Fees Quietly Eat Into Returns
An actively managed mutual fund charging a 1% annual expense ratio doesn't just cost you 1% once — that 1% compounds against you every single year, on a growing balance. Over 20-30 years, the difference between a 0.05% index fund and a 1% actively managed fund can amount to a meaningfully smaller ending balance, even if both funds had identical gross performance before fees.
What "Real" Return Actually Means
Your real, net return is: price change + dividends reinvested − fees − taxes. Most headline performance numbers you see quoted (in news articles, fund marketing, or a quick price chart glance) only capture the first piece. To know what you actually walked away with, you need to account for all four.
A Simplified Example
Say a stock's price grew 7% annually over 20 years with no dividends — a $10,000 investment becomes roughly $38,700. Now say a similar stock grew 5% in price but also paid a 2% dividend, reinvested annually — that's also a 7% total return, ending at roughly the same $38,700. On a price chart alone, the second stock would look like the "weaker" performer, even though the actual outcome was identical.
Common Mistakes to Avoid
1. Comparing two investments using price return only. A high-dividend stock and a low-dividend growth stock can have very different price charts while delivering similar total returns — always compare total return, not just the chart.
2. Ignoring expense ratios when picking funds. A seemingly small 0.5-1% difference in fees compounds significantly over decades — always check a fund's expense ratio before comparing its historical performance to alternatives.
3. Forgetting taxes on dividends and capital gains. Dividends and realized gains are usually taxable in a regular brokerage account, which further reduces your real, in-pocket return compared to the headline number.
4. Assuming reinvested dividends happen automatically. Unless you've specifically enrolled in a dividend reinvestment plan (DRIP) or your brokerage auto-reinvests, dividends may sit as uninvested cash rather than compounding — check your account settings.
5. Using nominal returns without adjusting for inflation. A 7% return sounds strong, but after accounting for inflation, your real purchasing-power gain could be notably lower — always keep inflation in mind for long-term goal planning.
Key Takeaway: The price chart is only one piece of your actual return — dividends reinvested add to it, while fees and taxes quietly subtract from it. Before comparing investments or judging performance, always look at total return, not just the line on a chart.
Frequently Asked Questions
What's the difference between price return and total return?
Price return only reflects the change in share price. Total return adds reinvested dividends on top, which for many stocks and funds makes a significant difference over long holding periods.
How much can fees really affect my long-term returns?
Even a 1% annual expense ratio compounds against your balance every year. Over 20-30 years, that can meaningfully reduce your ending balance compared to a low-cost index fund with similar gross performance.
Are dividends reinvested automatically in my brokerage account?
Not always — it depends on whether you've enrolled in a dividend reinvestment plan (DRIP) or your brokerage's default setting. Check your account settings if you want dividends to compound automatically.
Why does a low-dividend growth stock sometimes look better on a chart than a dividend stock with the same total return?
Because a price chart only shows share price movement, not the cash paid out as dividends. A dividend-paying stock's price grows more slowly by design, even if its total return (price plus dividends) matches a non-dividend stock.
Should I adjust my returns for inflation when planning for retirement?
Yes — nominal returns can overstate your actual purchasing-power growth. For long-term goals like retirement, using inflation-adjusted (real) return estimates gives a more accurate picture of what your money will actually buy.