
Fundamental Analysis 101: How to Read a Company's Balance Sheet Before Investing
Finzony Editorial Team
Finzony Desk
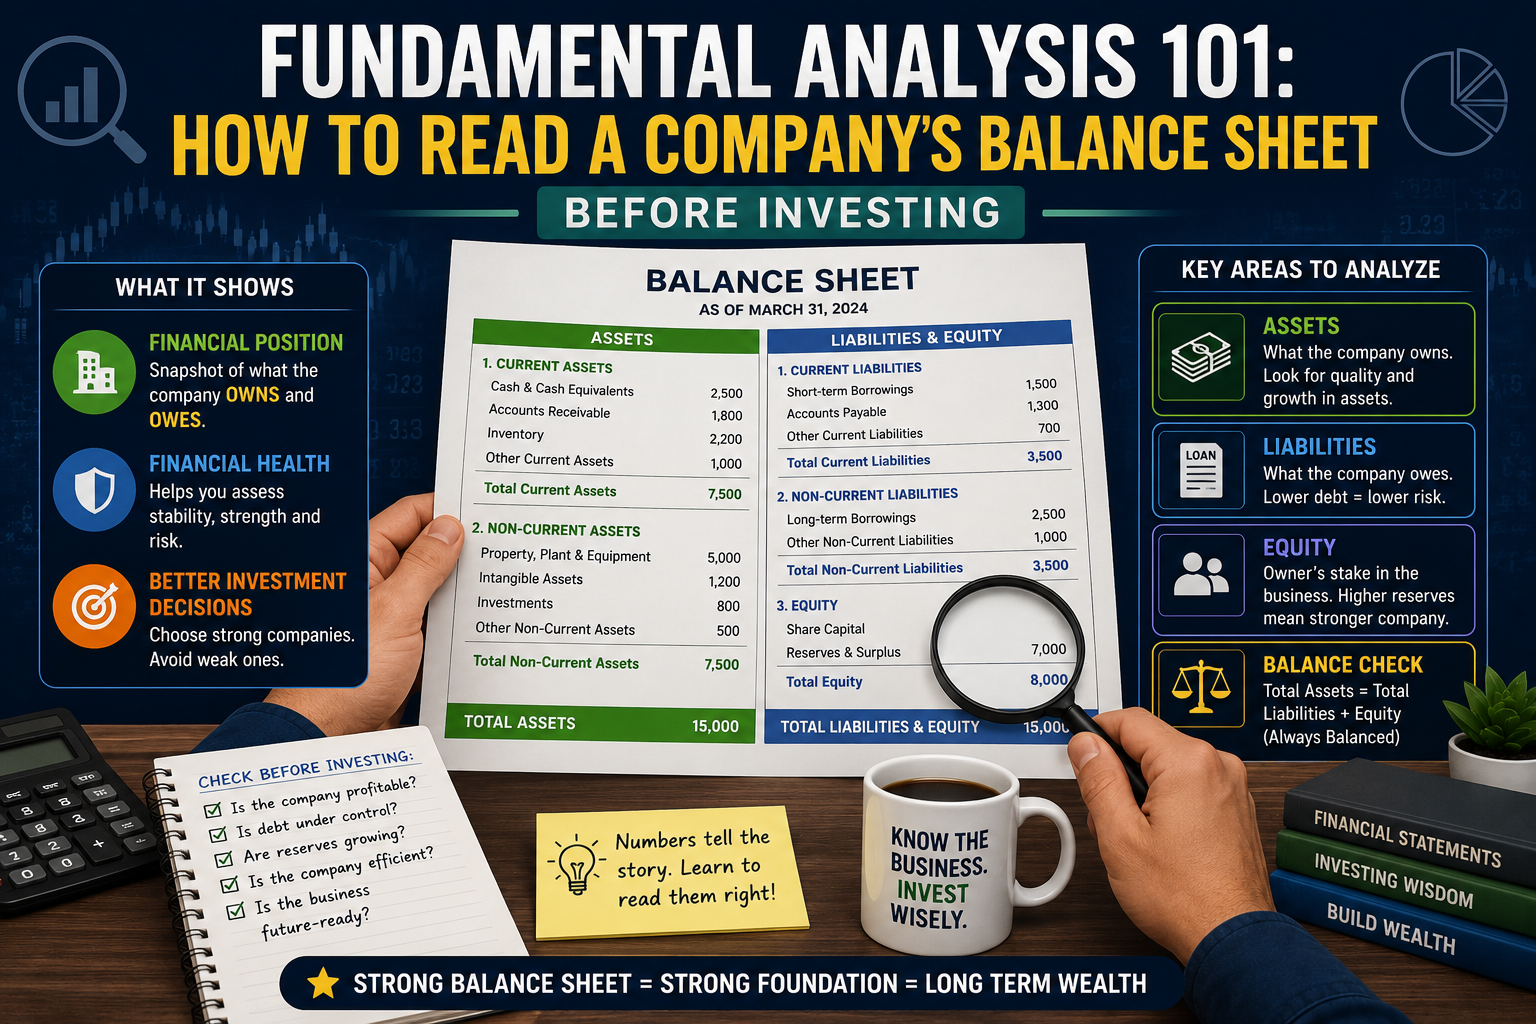
Before you buy a single share, a company's balance sheet can tell you whether it's built on solid ground or standing on debt. Here's how to read one without an accounting degree.
Why the Balance Sheet Matters More Than the Share Price
A falling share price feels like a warning sign, and a rising one feels like validation — but price alone tells you nothing about whether a business is actually healthy. The balance sheet is a snapshot, taken on a specific date, of everything a company owns (assets), everything it owes (liabilities), and what's left over for shareholders (equity). Reading it well is the core skill behind fundamental analysis.
The Three Sections, in Plain Language
Assets are what the company owns — cash, inventory, factories, receivables from customers, and investments. They're typically listed from most liquid (cash) to least liquid (land, buildings).
Liabilities are what the company owes — supplier payments, short-term borrowings, long-term loans, and bonds. Liabilities aren't automatically bad; a company that borrows cheaply to grow profitably is using debt well. The concern is debt that's expensive or excessive relative to earnings.
Shareholders' Equity is simply Assets minus Liabilities — the portion of the company that actually belongs to shareholders like you. Rising equity, year over year, is usually a healthy sign that the company is retaining and reinvesting profit.
Five Numbers Worth Checking Before You Buy
| Metric | What It Shows | Rough Guide |
|---|---|---|
| Debt-to-Equity Ratio | How much the company relies on borrowed money | Under 1 is generally comfortable; varies by sector |
| Current Ratio | Can it pay short-term bills with short-term assets? | Above 1.5 suggests healthy liquidity |
| Return on Equity (ROE) | How efficiently equity is turned into profit | Consistently above 15% is considered strong |
| Interest Coverage Ratio | Can earnings comfortably cover interest payments? | Above 3x gives a reasonable safety margin |
| P/E Ratio | How much you're paying per rupee of earnings | Compare against sector peers, not in isolation |
A low P/E doesn't automatically mean a stock is cheap, and a high P/E doesn't automatically mean it's expensive. Always compare a company against its own sector — a P/E of 40 might be reasonable for an IT company and alarming for a public sector bank.
Red Flags to Watch For
- Rising debt with falling profit: The company is borrowing to stay afloat, not to grow.
- Receivables growing faster than sales: Revenue is being booked, but cash isn't actually coming in — a common way companies dress up growth.
- Frequent auditor changes or qualified audit opinions: Worth investigating before you invest, not after.
- Promoter pledging: When a large share of promoter holding is pledged against loans, it signals financial stress at the top.
Where to Find This Data for Free
You don't need a Bloomberg terminal. Screener.in aggregates a decade of balance sheet, P&L, and cash flow data for every listed Indian company for free, and the NSE/BSE websites host quarterly results and annual reports directly from the source.
Frequently Asked Questions
How often should I re-check a company's balance sheet after buying?
Once a quarter, when results are announced, is a reasonable rhythm for most long-term investors — no need to check daily.
Is a company with zero debt always safer?
Usually more conservative, yes, but not always better. Some capital-intensive businesses (infrastructure, manufacturing) genuinely need debt to scale, and zero debt can sometimes mean missed growth opportunities.
What's the difference between fundamental and technical analysis?
Fundamental analysis studies the business itself — financials, management, industry — to judge whether a stock is worth owning. Technical analysis studies price and volume charts to judge timing.
Want to go deeper, one lesson at a time? Our free Fundamental Analysis course in the Finzony Academy walks through financial statements, ratios, and valuation from scratch.