
Technical Analysis for Beginners: How to Read Stock Charts in India
Finzony Editorial Team
Finzony Desk
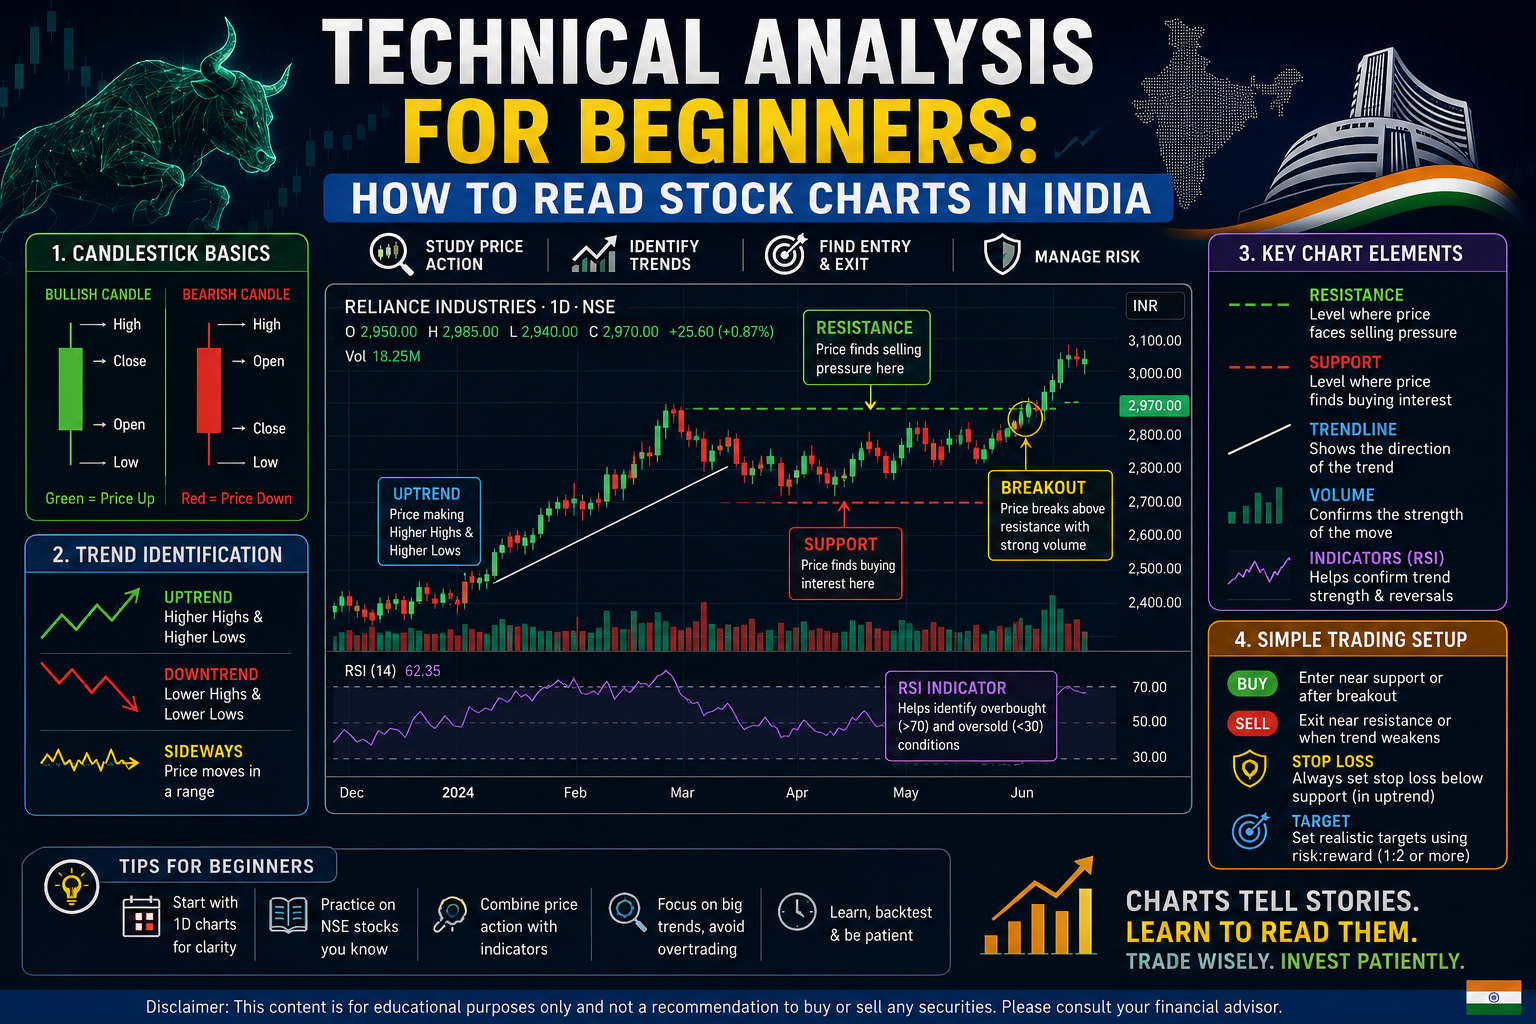
Every green and red candle on a stock chart is telling you a story. This guide breaks down the basics of technical analysis — candlesticks, support & resistance, and moving averages — so you can start reading charts like a trader, not just looking at them.
What Is Technical Analysis, Really?
Fundamental analysis asks "is this a good business?" Technical analysis asks a completely different question: "what is the price telling me right now?" Instead of digging through balance sheets, technical analysts study price and volume charts to spot patterns that tend to repeat because human behaviour — fear, greed, herd mentality — tends to repeat.
You don't need to pick a side. Most experienced Indian investors use fundamentals to decide what to buy and technicals to decide when to buy or sell. This guide covers the building blocks every beginner should know before opening a chart on Zerodha, Groww, or TradingView.
Reading a Candlestick
A candlestick shows four prices for a chosen time period (a day, an hour, five minutes — whatever you set): the open, close, high, and low. The "body" is the gap between open and close, and the thin lines above and below (called wicks or shadows) show the high and low.
- Green/white candle: Close was higher than open — buyers were in control.
- Red/black candle: Close was lower than open — sellers were in control.
- Long wicks: Price moved a lot in one direction but got pushed back — a sign of rejection at that level.
A single candle rarely tells you much. It's the pattern of several candles together, at the right location on the chart, that matters.
Support and Resistance: The Foundation of Every Chart
Support is a price level where a stock has historically stopped falling and bounced back up, because enough buyers step in there. Resistance is the opposite — a level where selling pressure has repeatedly capped the price. Once you start marking these zones on a chart, price action starts to look far less random.
A support level that gets broken with strong volume often flips into resistance the next time price approaches it from below. Traders call this "role reversal," and it's one of the most reliable patterns in technical analysis.
Moving Averages: Smoothing Out the Noise
A moving average (MA) plots the average closing price over a set number of periods — the 50-day MA, for example, averages the last 50 closes and updates daily. It smooths out day-to-day noise so you can see the underlying trend.
| Moving Average | Common Use | What It Tells You |
|---|---|---|
| 20-day MA | Short-term trend | Recent momentum, used by swing traders |
| 50-day MA | Medium-term trend | Institutional support/resistance zone |
| 200-day MA | Long-term trend | Overall market health; price above it is generally bullish |
A "golden cross" — when the 50-day MA crosses above the 200-day MA — is widely watched as a bullish signal. The opposite, a "death cross," is read as bearish. Neither is a guarantee, but both tend to attract attention and trading volume.
Three Chart Patterns Worth Knowing
Head and Shoulders: Three peaks, with the middle one highest, often signals a trend reversal from up to down.
Double Top / Double Bottom: Price tests a level twice and fails to break through, suggesting the current trend is losing steam.
Triangles: Price coils into a narrowing range before breaking out sharply in one direction — the "calm before the move."
A Word of Caution
Technical analysis improves your odds; it doesn't guarantee outcomes. Patterns fail, especially around results announcements, RBI policy days, or global shocks. Beginners should paper trade first, use strict position sizing, and never treat a chart pattern as a certainty.
Frequently Asked Questions
Is technical analysis useful for long-term investors, or only traders?
It's most powerful for short and medium-term trading, but even long-term investors use it to time entries — for example, waiting for a stock to hold above its 200-day moving average before adding to a position.
Which chart timeframe should a beginner start with?
Daily charts are the easiest starting point. Intraday charts (5-minute, 15-minute) move fast and are better attempted once you're comfortable reading daily candles and trends.
Do I need paid software to do technical analysis in India?
No. Most Indian brokers (Zerodha's Kite, Upstox, Groww) include free charting tools, and TradingView's free plan is more than enough for a beginner.
Want a structured, lesson-by-lesson walkthrough instead of a single article? Our free Technical Analysis course in the Finzony Academy covers charts, indicators, and patterns in depth, at your own pace.